Exponential and Geometric Distributions: A COVID-19 Example
We are going through though times facing the COVID-19. National borders are limited, business, schools, and restaurants closed, conferences, public and sport events cancelled. People and governments worldwide are doing everything they can to stop the spread of the SARS-CoV-2 virus. And it is spreading fast, exponentially fast. But how fast is something that is considered exponential?
The main mode of transmission of this virus is via respiratory droplets that people exhale when coughing or sneezing. Droplets fall on surfaces and other people touch those surfaces. Their hands become contaminated but their respiratory system is still safe as long as they wash their hands before the next time they touch their faces. The awareness around COVID-19 made me realize how frequently I touch my face. I touch it to think, to relax, to scratch, I can’t help it. I also noticed at work and walking on the streets that everybody does the same. An expert was telling on TV we touch our faces an average of 23 times per hour. In other words, if you don’t practice physical distancing and don’t frequently wash your hands you will eventually get sick, and worse, spread the virus out there.
The Wikipedia article states that the average number of people an infected person is likely to infect ranges from 2.13 to 4.82. Let’s pick a number within this range: 3. So, if you get contaminated and symptoms start showing, you will likely contaminate 3 other people, probably within your family. Each one of those people will contaminate other 3, extending the disease outside of the house to friends and co-workers. They will contaminate their own families and so on and so on, characterizing an exponential distribution. I’m not kidding. This is real! Look at the following chart, showing the exponential spread in Italy.
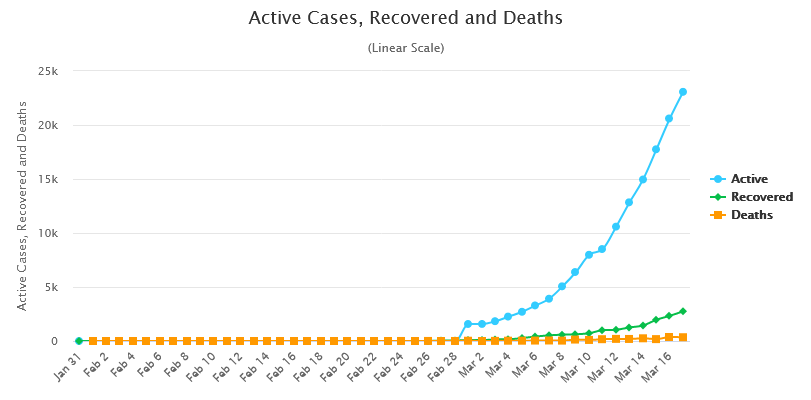
You can recognize an exponential distribution when the next point in the chart is the previous point raised to a certain power, forcing the chart to rapidly increase or decrease.
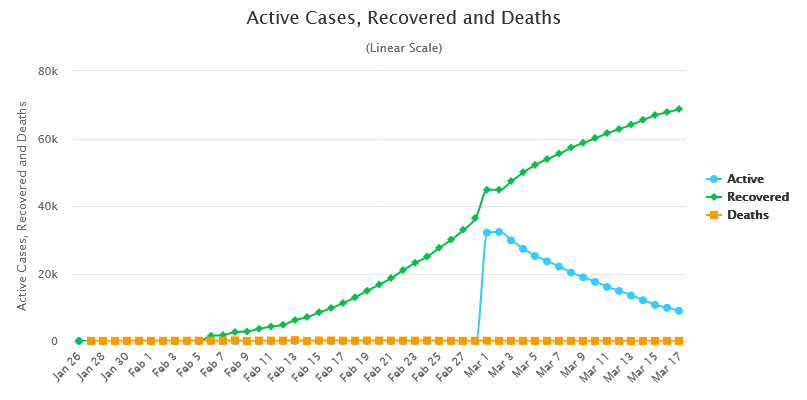
Once sick, 80% of the population gets recovered after 2 weeks, feeling just mild symptoms. 20% are immune-suppressive to some degree and remain sick in the third week with complications such as pneumonia and liver failure. Unfortunately, 4% don’t make it. What we notice here is that recovery is timeboxed. The cases are closed not in the same exponential rate, but in a geometric rate. Look at the green line in the chart that shows the recovery in China.
Geometric distributions are more general and involve performing operations on numbers such as multiplying or dividing the previous point by a factor to get the next point.
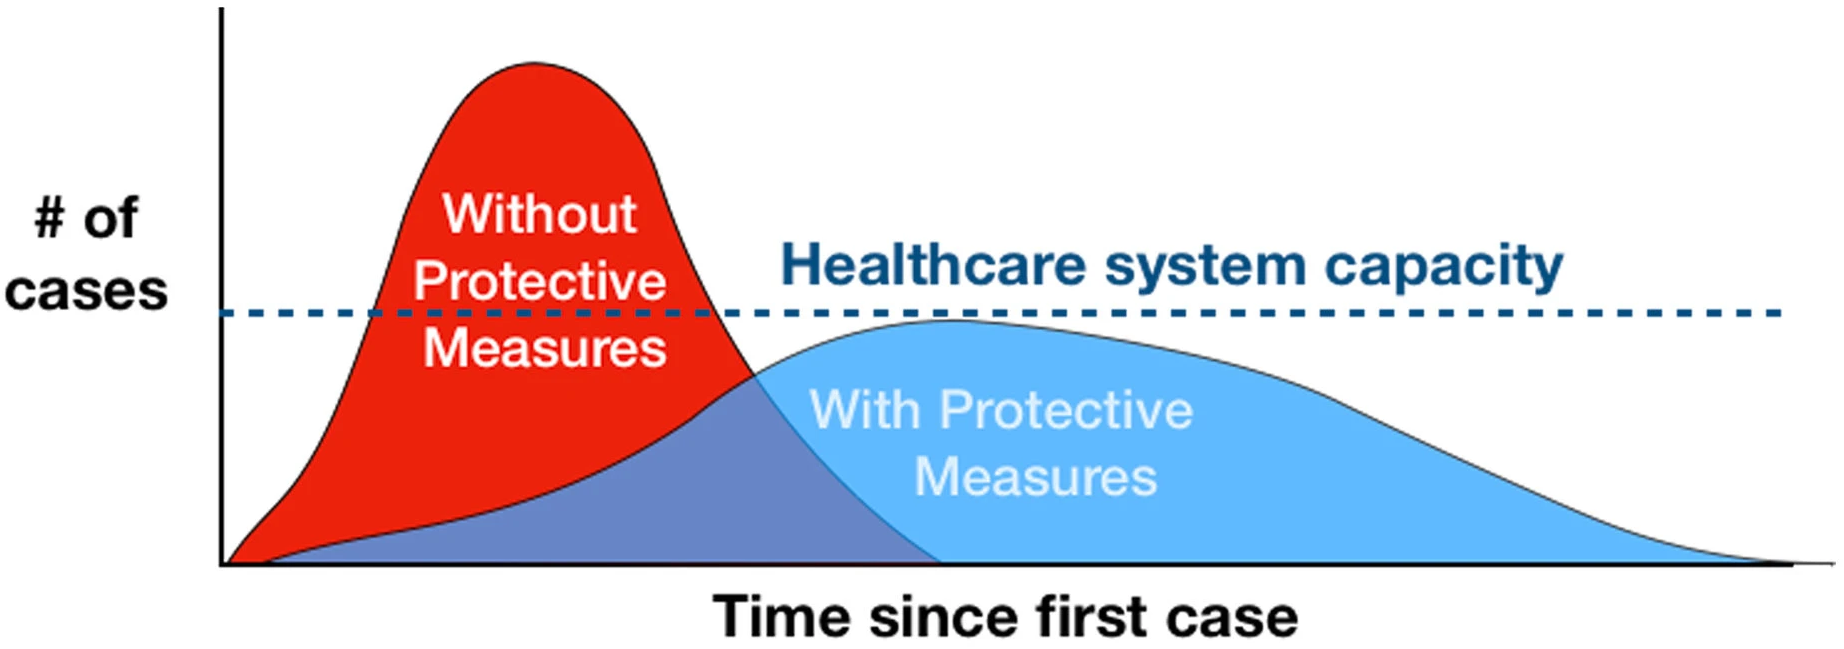
The real world doesn’t precisely follow these concepts. We can see little discrepancies in the data caused by under reporting, errors, and the randomness of nature. But the theory allows us to identify patterns and take protective measures to flatten the curve to levels our healthcare system can deal with.
Recent Posts
Can We Trust Marathon Pacers?
Introducing LibRunner
Clojure Books in the Toronto Public Library

Once Upon a Time in Russia

FHIR: A Standard For Healthcare Data Interoperability
First Release of CSVSource
Astonishing Carl Sagan's Predictions Published in 1995

Making a Configurable Go App
Dealing With Pressure Outside of the Workplace
Reacting to File Changes Using the Observer Design Pattern in Go
Provisioning Azure Functions Using Terraform
Taking Advantage of the Adapter Design Pattern
Applying The Adapter Design Pattern To Decouple Libraries From Go Apps
Using Goroutines to Search Prices in Parallel
Applying the Strategy Pattern to Get Prices from Different Sources in Go